This document makes references to the 1998-1999 MU Station yearly report.
This report summarizes information gathered on the open access facility in the MU. Called the Station, the facility was opened at the start of the Fall 98 academic quarter and represents a unique collaboration between Student Affairs, ASUCD, and Information Resources to provide on campus computing access for students. The facility is managed and operated by the Information Resources Lab Management group. Several log reports were summarized to identify some of the facility's activities, the rate of these activities, and the number of people who used the facility. This is the second yearly report on the Station's activities and includes the following:
Due to the unusually high traffic flow and large numbers of people waiting in line, Lab Management redesigned the The Station during the Summer of 2000. The redesign included the relocation and expansion of space for the waiting line, supplies, the file server, and the consultants.
The changes that were made include:
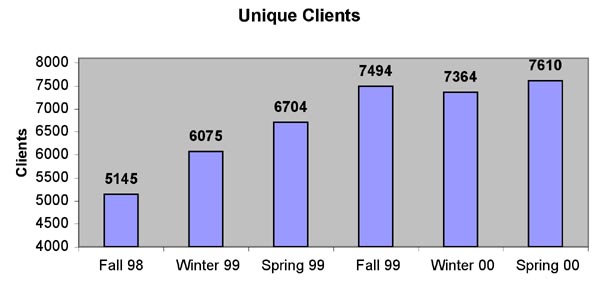
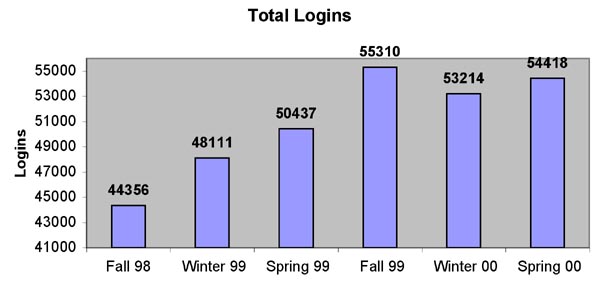
The total number of clients who used a Lab Management facility in Fall 99 increased to about 14,300 from 13, 900 in Fall 98. The Station's popularity has steadily increased since it's opening in Fall 98. The percentage of total clients served in the Station increased from 37 percent in Fall 98 to 52 percent in Fall 99, which means that over half of all of our clients use the Station each quarter. The Station's 34 computers served a record 7,610 clients in Spring 00. On average, each computer in the facility would be used by 223 individuals. The total number of logins in Fall 99 increased by 25 percent from Fall 98. The graphs below represents the data gathered for unique clients and total logins.
.
|
 |
Since not every client used the Station every single quarter, the total number of clients for the year was much higher. There were 11,187 individuals who used the Station during the 99-00 academic year. The number of student clients, 10, 772, represents roughly 55 percent of the UC Davis student population. This excludes students of the professional schools. Such numbers would indicate that each computer over the year would see an average of 329 unique users.
Another major indication of use for the facility is its utilization rates. As with the number of logins and clients, utilization rates show a general increasing trend. However, the facility has reached saturation point and any further growth during the peak times of 8 AM to 6 PM is not possible. Its utilization rate is typically above the average utilization rate for the other 14 computer rooms operated by Lab Management. The rates are also slightly higher than those of the TB114 open access facility which was opened in Fall 97. The graph below displays the utilization trend over the academic quarters and excludes weekend usage.
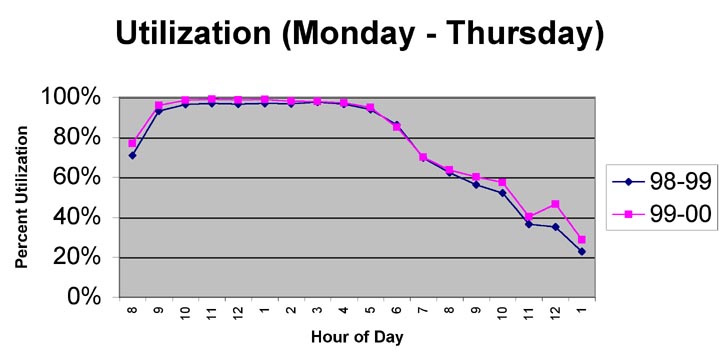 |
The Station was the only computer room made available after midnight, closing at 2 AM, during the three weeks prior to finals week each quarter. The peak at midnight clearly indicates that students from other computer rooms that were closing went to the MU to take advantage of the final two hours of operation. The midnight peak during 99-00 is even more dramatic than the previous year indicating that more students have become aware of the extended hours.
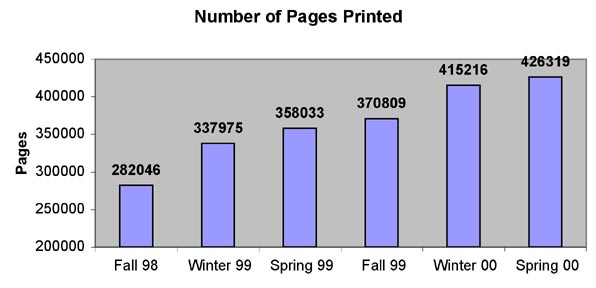
A major function of the Station was to allow students to print academic material. Following the general trend at all of the Lab Management facilities, the Station showed an increase in numbers printed during its first two years of operation. Its 426,319 pages printed during the Spring 00 quarter represents roughly 23 percent of the printing at all of the Lab Management facilities. At the rates indicated, each client during the Spring Quarter would have had to print an average of 56 pages. The total number of pages printed of 1,212,344 for the 99-00 academic year was a 24 percent increase over the previous year.
 |
Though a variety of software was provided for the 19 Windows based and 15 Mac based computers at the Station, the great majority of the software type used can be narrowed to three categories: web browsers, telnet applications, and word processors. The graph below represents some of the major software types used at the Station.
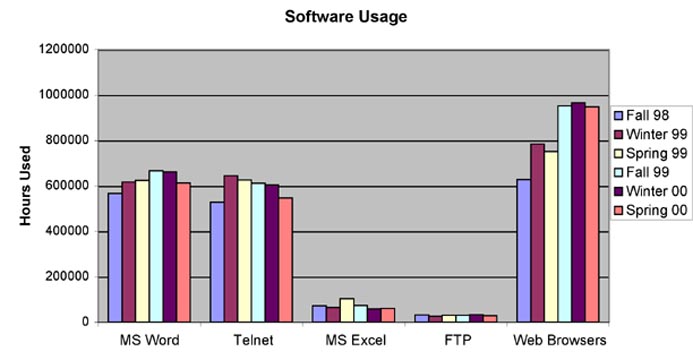 |
Telnet utilization typically equates to students accessing e-mail via pine on the campus' ISUN servers. The steady usage decline of telnet applications combined with the sharp increase of web browsers is indicative of students using web based e-mail applications in lieu of pine. The web browers growth is likely also driven by instructors' increasing use of the web to distribute class materials. File transfer applications such as FTP showed slight usage which indicates that users may be utilizing the Station to obtain distributed software and documents.
Fiscal 98-99
While specific supply costs for the MU can be tabulated and detailed, costs related to labor can, at this time, only be calculated as a percentage of total costs for all the campus computer rooms. Costs for consultants, hardware support crew, management and administrative support are considered in identifying yearly costs of operation for the Station. Supply costs include paper and toner for printing, support supplies such as staples and paper clips, and various cleaning supplies. Below are tables representing each of these costs. Costs were considered for 33 weeks of operation at 94 hours of operation per typical week and 102 hours of operation during extended hours three weeks prior to finals.
|
Student Consultant |
$29,349 |
|
Hardware Support Staff |
$2,744
|
|
Administrative Support |
$3,402
|
|
Management Support |
$11,161
|
|
Total Labor Costs |
$46,656
|
| Total Supply Costs |
$7,720 |
| Total Operational Costs |
$54,376
|
Compared with other Lab Management facilities, the Station's total costs would always be greater as it is open more hours and support costs for the consultant can not be split for an adjoining computer facility. Facilities such as those located in Surge IV have one consultant supporting as many as three rooms at one time. Costs on a per user or per login basis may show that the Station is actually more cost effective. At $5.80 per user and 38 cents per login, it is far below the overall Lab Management costs of $50 per user and $1.22 per login for all facilities during Fiscal 98-99.
Fiscal 99-00
After its first year of operation, a more detailed analysis of costs were calculated based on historical and comparative lab costs. Added to the costs are equipment and major facilities expenses considered cyclical expenses requiring yearly contributions. Equipment is listed on a three year cycle while furniture, considered a major component of facilities work, is expected to have a 4-6 year life cycle. The high volume of traffic may necessitate a readjustment of facilities costs as well as computer costs based on actual wear. These costs were not included in the previous year's expenses and were included in anticipation of operation beyond the original three year pilot. Below are tables representing each of these costs. Costs were considered for 47 weeks of operation during the 99-00 fiscal year at 94 hours of operation per typical week and 102 hours of operation during extended hours three weeks prior to finals.
|
Student Consultant |
$29,349 |
|
Hardware Support Staff |
$2,561
|
|
Administrative Support |
$3,175
|
|
FTE Support |
$15,702 |
|
Total Labor Costs |
$50,787
|
| Supply Costs |
$17,815 |
|
Equipment Cycle Cost |
$26,242
|
|
Facilities Cycle Cost |
$7,000
|
| Total Operating Expenses |
$51,057
|
| Total Yearly Expenses |
$101,844
|
The costs listed above are expected to increase next year based on both labor rate increases and supply cost increases. Lab Management has submitted a proposal to obtain permanent funding beyond the three year pilot period of operation.
| Comments:
labmanager@ucdavis.edu
URL: http://lm.ucdavis.edu/pubs/mureport Last updated: September 22, 2000 |