
This report summarizes information gathered on the open access facility in the MU. Called the Station, the facility was opened at the start of the Fall 98 academic quarter and represents a unique collaboration between Student Affairs, ASUCD, and Information Resources to provide on campus computing access for students. The facility is managed and operated by the Information Resources Lab Management group. Several log reports were summarized to identify some of the facility's activities, the rate of these activities, and the number of people who used the facility. This is the first yearly report on the Station's activities and includes the following:
General operational costs are also included in this report.
From the start, the Station proved to be a popular location. Its 5145 clients in Fall 98 represented 37 percent of the nearly 14,000 clients that used the Lab Management facilities. As more students became aware of this facility, the number of logons and the number of users grew each quarter. By Spring 99, nearly 1600 additional people used the facility's 34 computers. On average, each of the facility's computer would be used by 197 individuals during the Spring quarter. The graph below represents the data gathered.
Since not every client used the Station all three quarters, the total number of clients for the year was much higher. There were 9378 individuals who used the Station during the 98-99 academic year. The number of student clients, 9089, represents roughly 40 percent of the UC Davis student population. This excludes students of the professional schools. Such numbers would indicate that each computer over the year would see an average of 275 unique users.
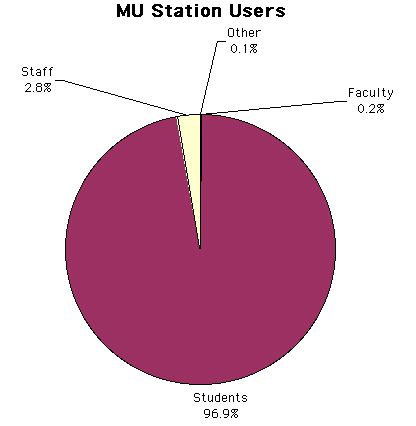
Of the 9378 individuals, most were students. The facility did attract both faculty and staff with 19 faculty and 260 staff members utilizing the open access room during the year. The graph below clearly shows the type of clients one can expect to see at the Station.
Another major indication of use for the facility is its utilization rates. As with the number of logins and clients, utilization rates show a general increasing trend. However, the facility has reached saturation point and any further growth during the peak times of 8 AM to 6 PM is not possible. Its utilization rate is typically above the average utilization rate for the other 14 computer rooms operated by Lab Management. The rates are also slightly higher than those of the TB114 open access facility which was opened in Fall 97. The graph below displays the utilization trend over the academic quarters and excludes weekend usage.
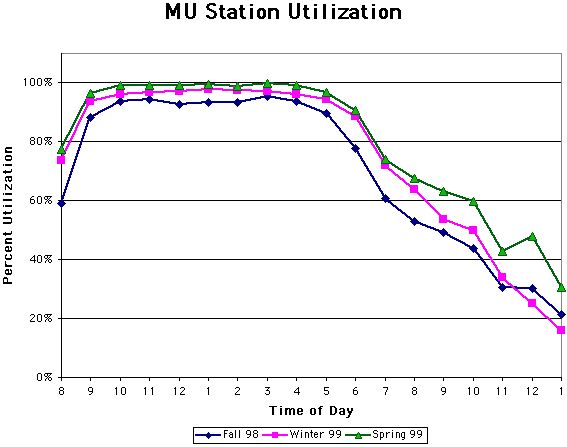
The Station was the only computer room made available after midnight, closing at 2 AM, during the three weeks prior to finals week during Winter and Spring quarters. In Fall 98, TB114 was also left open past midnight during the same pre-finals period. The peak at midnight during the Spring 99 quarter clearly indicates that students from other computer rooms that were closing went to the MU to take advantage of the final two hours of operation.
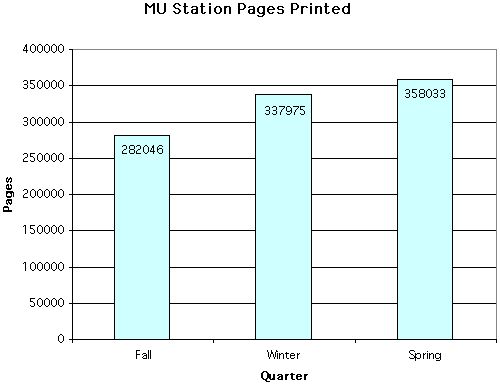
A major function of the Station was to allow students to print academic material. Following the general trend at all of the Lab Management facilities, the Station showed an increase in numbers printed over the year. Its 358,000 pages printed during the Spring 99 quarter represents roughly 20 percent of the printing at all of the Lab Management facilities. At the rates indicated, each client during the Spring Quarter would have had to print an average of 54 pages.
Though a variety of software was provided for the 19 Windows based and 15 Mac based computers at the Station, the great majority of the software type used can be narrowed to three categories: web browsers, telnet applications, and word processors. The graph below represents some of the major software types used at the Station.

Telnet utilization typically equates to students accessing email via pine on the campus' ISUN servers. Since telnet can also include a variety of functions, its data was not combined with Eudora which is an email application. File transfer applications such as FTP showed slight usage which indicates that users may be utilizing the Station to obtain distributed software and documents.
While specific supply costs for the MU can be tabulated and detailed, costs related to labor can, at this time, only be calculated as a percentage of total costs for all the campus computer rooms. Costs for consultants, hardware support crew, management and administrative support are considered in identifying yearly costs of operation for the Station. Supply costs include paper and toner for printing, support supplies such as staples and paper clips, and various cleaning supplies. Below are tables representing each of these costs. Costs were considered for 33 weeks of operation at 94 hours of operation per typical week and 102 hours of operation during extended hours three weeks prior to finals.
|
Student Consultant |
$29,349 |
|
Hardware Support Staff |
$2,744
|
|
Administrative Support |
$3,402
|
|
Management Support |
$11,161
|
|
Total Labor Costs |
$46,656
|
| Total Supply Costs |
$7,720 |
| Total Operational Costs |
$54,376
|
Compared with other Lab Management facilities, the Station's total costs would always be greater as it is open more hours and support costs for the consultant can not be split for an adjoining computer facility. Facilities such as those located in Surge IV have one consultant supporting as many as three rooms at one time. Costs on a per user or per login basis may show that the Station is actually more cost effective. At $5.80 per user and 38 cents per login, it is far below the overall Lab Management costs of $50 per user and $1.22 per login for all facilities during Fiscal 98-99.
| Comments:
pgblando@ucdavis.edu
URL: http://lm.ucdavis.edu/pubs/ Last updated: July 6, 1999 |